Summary
This section provides an overview of the ARC’s financial performance during 2016–17 for both departmental and administered activities. It should be read in conjunction with the information on financial performance provided in Part 6 which includes:
- the Australian National Audit Office report on the ARC’s financial statements
- the ARC’s financial statements (including a statement from the Chief Executive Officer and Acting Chief Financial Officer).
The ARC’s Resource Statement and Expenses for Outcome 1 in 2016–17 are provided in Appendix 4 (Tables A3 and A4 respectively).
The ARC’s total appropriated resources for 2016–17 were $777.9 million. This comprised:
- $751.3 million for the administered appropriation ($744.4 million special appropriation for the National Competitive Grants Program and $6.9 million for the annual administered appropriation)
- $26.6 million for the departmental appropriation ($21.8 million for operating expenses, $1.3 million for the Departmental Capital Budget and $3.5 million for an equity injection).
Departmental activities
Departmental activities include assets, liabilities, revenues and expenses that the ARC controls directly and uses to produce outcomes on behalf of the Australian Government.
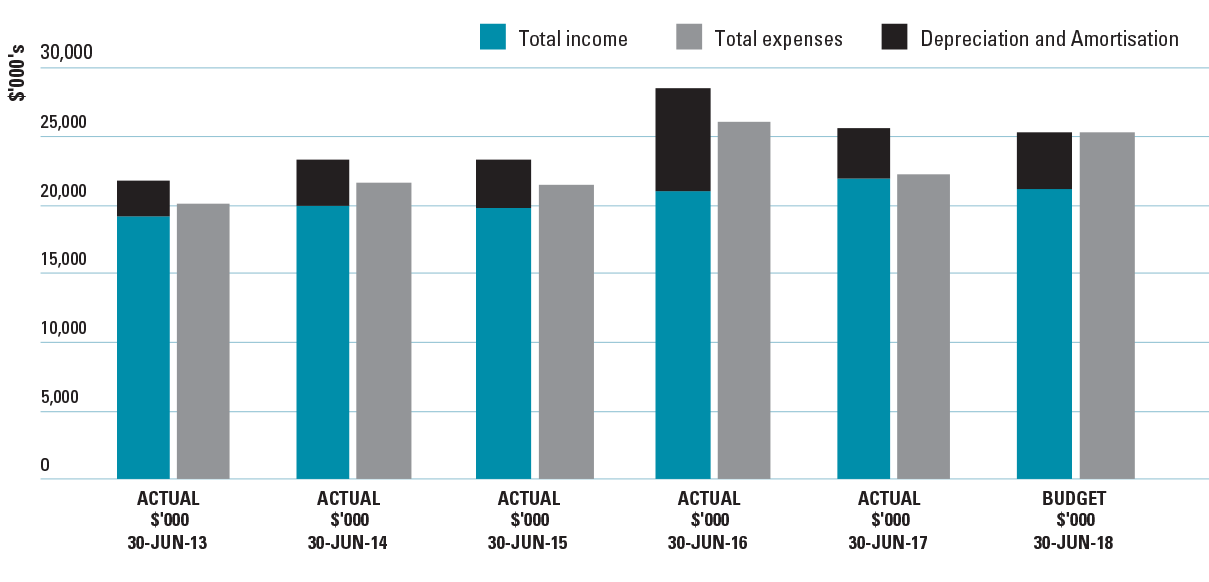
Figure 10 outlines the ARC’s departmental financial performance over the past five years and the current budget for 2017–18. Expenditure and Government revenue has been consistent over the 2012–13 to 2014–15 financial years. The increase in 2015–16 and 2016–17 expenditure budget mainly reflects the 2015–16 Mid-Year Economic and Fiscal Outlook (MYEFO) measures relating to the National Innovation and Science Agenda.
For 2016–17, the ARC recorded an operating deficit of $0.3 million. If the depreciation and amortisation expenditure is excluded to account for the net cash arrangements this results in a $3.4 million surplus.
As indicated in Figure 10 depreciation and amortisation costs for 2015–16 were greater than in previous years and 2016–17. This is mainly attributable to the completion of the Research Management System (RMS) intangible asset in 2015–16. With the completion of the RMS the aged and non-compatible components of the previous RMS were assessed as no longer having a useful life.

Administered activities
Administered activities includes assets, liabilities, revenues and expenses that are managed by the ARC on behalf of the Government which includes grants and supplier costs.
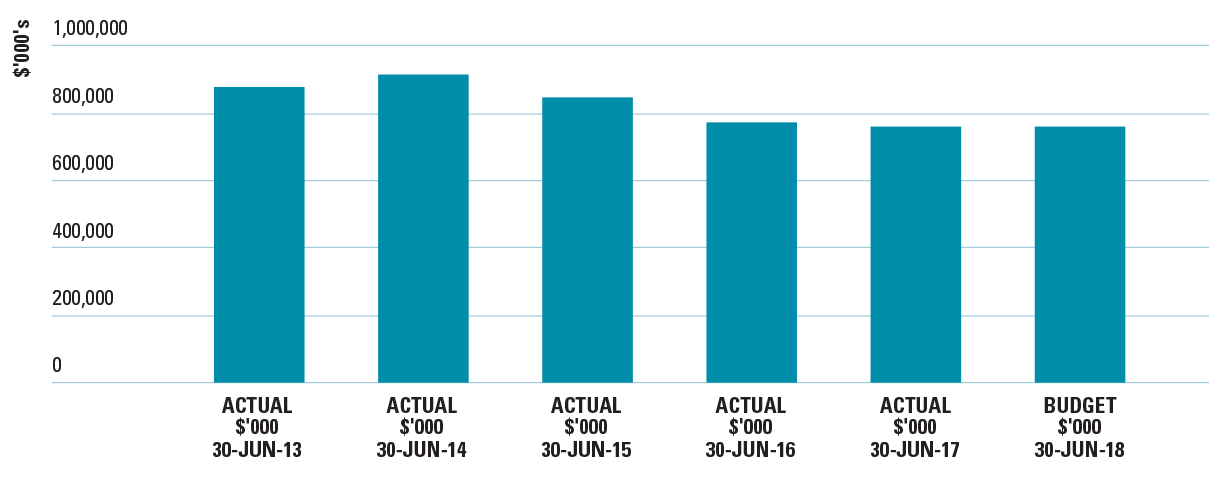
Figure 11 outlines the ARC’s administered financial expenditure over the past five years and the budget for 2017–18. The expenditure fluctuates from year to year and reflects the Government’s priorities and also the timing of when expenditure has been recognised.
