Section 1: Additonal Reporting on ERA 2015
Diversity within Institutions
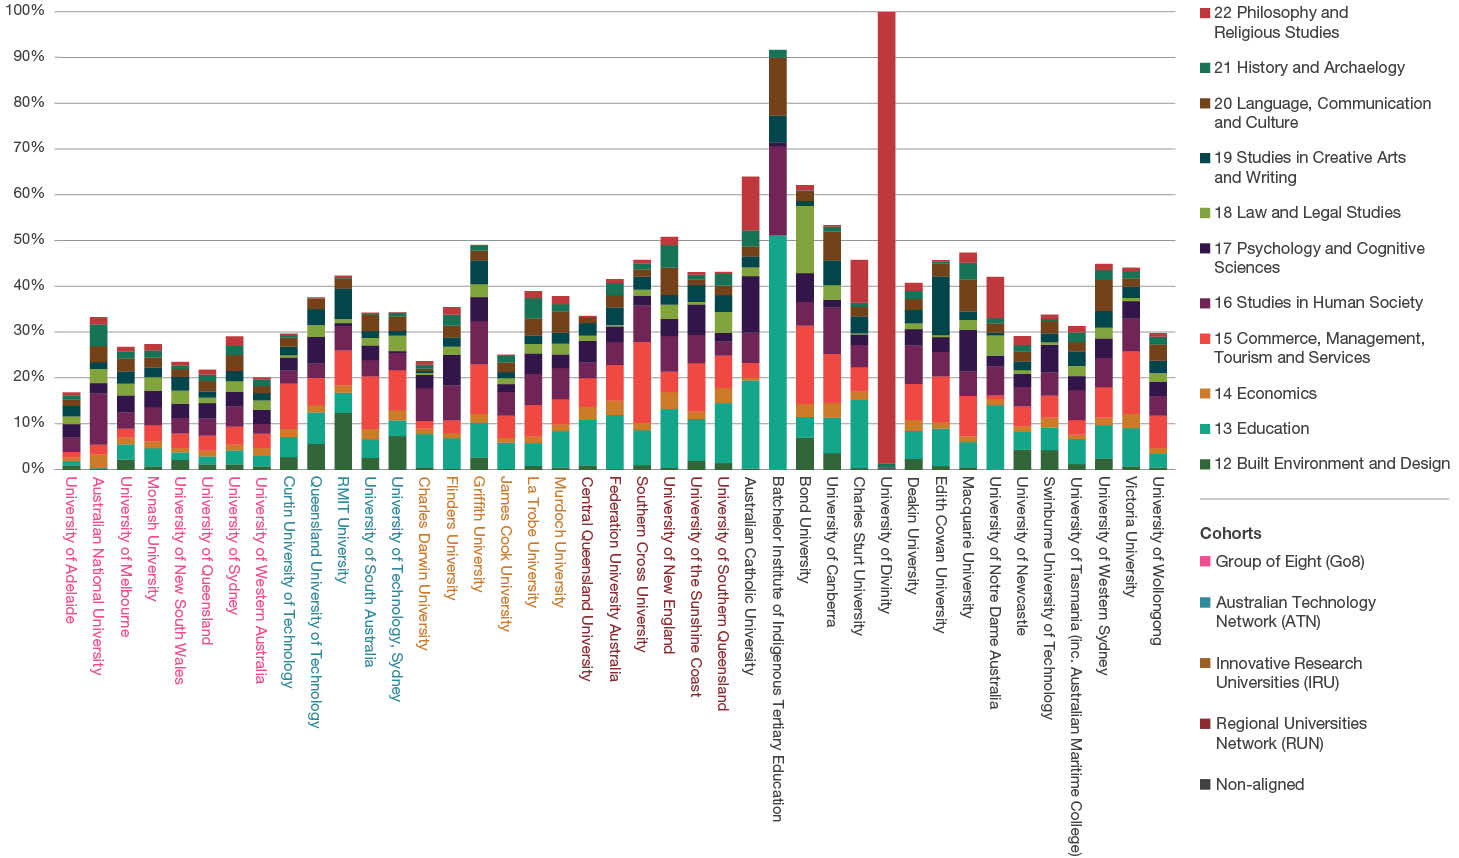
The following charts show the percentage distribution of submitted outputs and FTE staff across two-digit FoR codes by institution. The institutions are grouped by cohort (i.e. Group of Eight (Go8), Australian Technology Network (ATN), Innovative Research Universities (IRU), Regional Universities Network (RUN), and non-aligned). These charts highlight the considerable diversity in discipline focus between institutions and across cohorts–a key strength of the Australian higher education sector.
The first chart shows what percentage of outputs each institution submitted under FoR codes 01 Mathematical Sciences through to 11 Medical and Health Sciences; the second chart shows each institution’s output distribution across codes 12 Built Environment and Design through to 22 Philosophy and Religious Studies. The third and fourth charts show the distribution of submitted FTE staff for each institution.
Distribution of submitted outputs by FoR code (01 to 11) and institution
Click on image to enlarge in a new window
Distribution of submitted outputs by FoR code (12 to 22) and institution
Click on image to enlarge in a new window
Distribution of submitted FTE staff by FoR code (01 to 11) and institution
Click on image to enlarge in a new window
Distribution of submitted FTE staff by FoR code (12 to 22) and institution
Click on image to enlarge in a new window


