Section 3: Results by Fields of Research Code
20 Language, Communication and Culture
Language, Communication and Culture is comprised of the following four-digit codes:
- 2001 Communication and Media Studies
- 2002 Cultural Studies
- 2003 Language Studies
- 2004 Linguistics
- 2005 Literary Studies
- 2099 Other Language, Communication and Culture
15 out of 33 two-digit UoEs and 43 out of 77 four-digit UoEs assessed were rated above world standard
FoR Overview
Language, Communication and Culture (20) contributed approximately three per cent of the research outputs to ERA 2015. While journal articles were the most common research output type (48 per cent), a significant proportion were book chapters (36 per cent). Cultural Studies (2002) and Literary Studies (2005) were the two largest disciplines in terms of research outputs and staff FTE. Linguistics (2004) had the largest amount of research income, whereas Communication and Media Studies (2001) had the largest amount of research commercialisation income.
| Indicator |
No. |
|---|---|
Research outputs |
13,409.7 |
Research income |
$96,737,219 |
FTEs |
1,574.9 |
Esteem count |
224.0 |
Patents |
- |
Research commercialisation income |
$12,963 |
| Rating |
Distribution |
|
|---|---|---|
| Two-digit |
Four-digit |
|
5 |
4 |
12 |
4 |
11 |
31 |
3 |
13 |
28 |
2 |
5 |
6 |
1 |
0 |
0 |
Total |
33 |
77 |
Number of UoEs per rating scale score
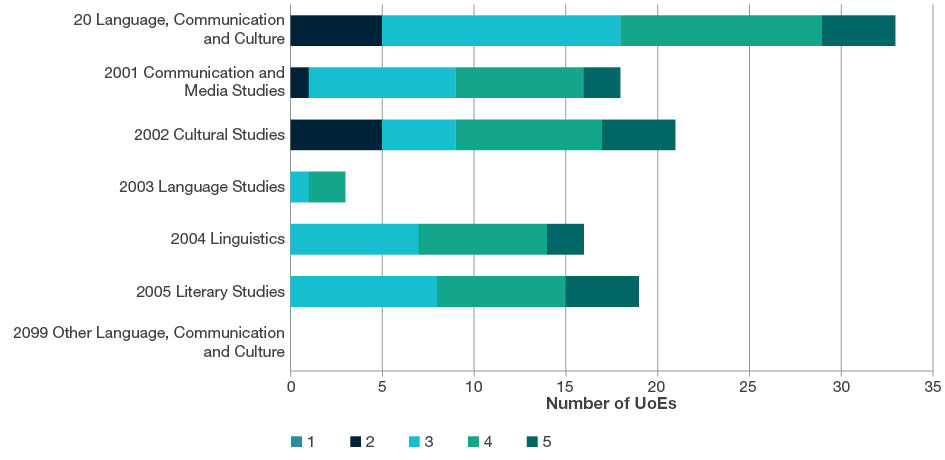
Note: 20 Language, Communication and Culture shows assessed two-digit UoEs only.
Research outputs submitted by type

| FoR code |
Book |
Book Chapter |
Journal Article |
Conference Paper |
NTRO |
Total |
|---|---|---|---|---|---|---|
2001 Communication and Media Studies |
120.3 |
629.5 |
1,240.5 |
271.9 |
87.0 |
2,349.1 |
2002 Cultural Studies |
230.5 |
1,279.1 |
1,733.5 |
162.7 |
80.8 |
3,486.7 |
2003 Language Studies |
60.8 |
299.4 |
355.7 |
114.9 |
5.5 |
836.2 |
2004 Linguistics |
162.3 |
1,065.9 |
1,445.2 |
383.5 |
47.8 |
3,104.7 |
2005 Literary Studies |
232.3 |
1,347.3 |
1,578.3 |
77.8 |
40.3 |
3,275.9 |
2099 Other Language, Communication and Culture |
16.8 |
153.6 |
135.9 |
47.0 |
3.8 |
357.0 |
Total |
822.9 |
4,774.8 |
6,489.1 |
1,057.7 |
265.2 |
13,409.7 |
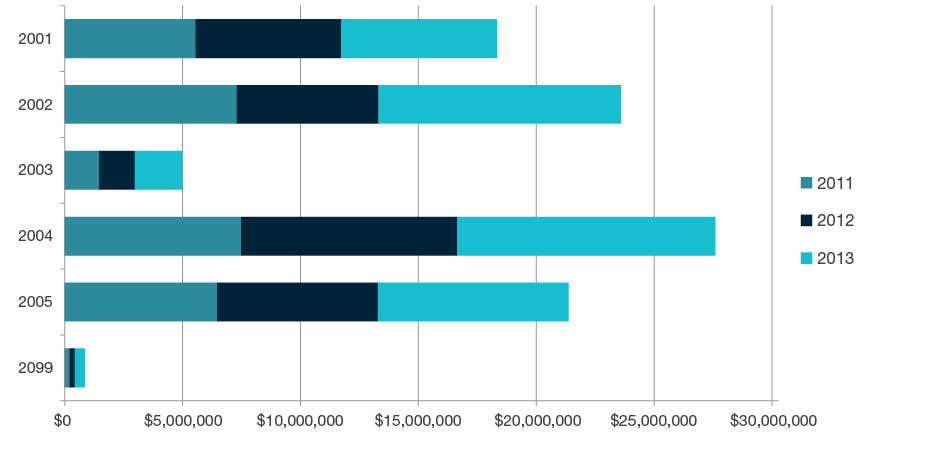
Research income by year-all categories ($)
| FoR code |
2011 ($) |
2012 ($) |
2013 ($) |
Total ($) |
|---|---|---|---|---|
2001 Communication and Media Studies |
5,539,117 |
6,184,345 |
6,613,315 |
18,336,776 |
2002 Cultural Studies |
7,305,859 |
6,012,426 |
10,268,798 |
23,587,083 |
2003 Language Studies |
1,457,381 |
1,519,725 |
2,003,742 |
4,980,847 |
2004 Linguistics |
7,481,569 |
9,157,277 |
10,958,845 |
27,597,691 |
2005 Literary Studies |
6,461,314 |
6,819,737 |
8,096,725 |
21,377,776 |
2099 Other Language, Communication and Culture |
193,308 |
231,886 |
431,853 |
857,046 |
Total |
28,438,547 |
29,925,395 |
38,373,277 |
96,737,219 |
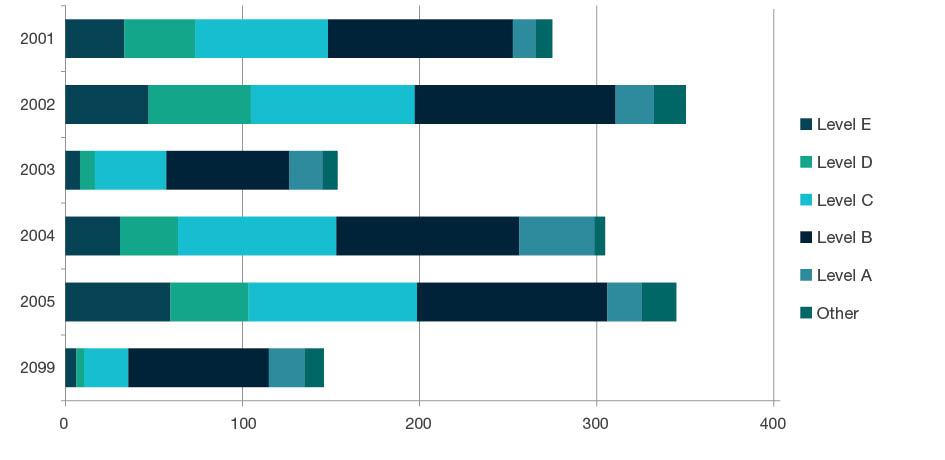
Staffing profile by academic level
| FoR code |
Level E |
Level D |
Level C |
Level B |
Level A |
Other FTE |
Total |
|---|---|---|---|---|---|---|---|
2001 Communication and Media Studies |
33.2 |
40.3 |
74.8 |
104.4 |
12.7 |
9.6 |
275.0 |
2002 Cultural Studies |
46.9 |
57.7 |
92.7 |
113.4 |
21.8 |
17.9 |
350.4 |
2003 Language Studies |
8.2 |
8.4 |
40.4 |
69.2 |
18.8 |
8.7 |
153.7 |
2004 Linguistics |
30.9 |
32.7 |
89.4 |
103.5 |
42.6 |
5.7 |
304.8 |
2005 Literary Studies |
59.2 |
44.1 |
95.2 |
107.5 |
19.3 |
19.6 |
345.0 |
2099 Other Language, Communication and Culture |
6.1 |
4.4 |
25.0 |
79.4 |
20.1 |
11.0 |
146.0 |
Total |
184.5 |
187.5 |
417.5 |
577.4 |
135.5 |
72.5 |
1,574.9 |
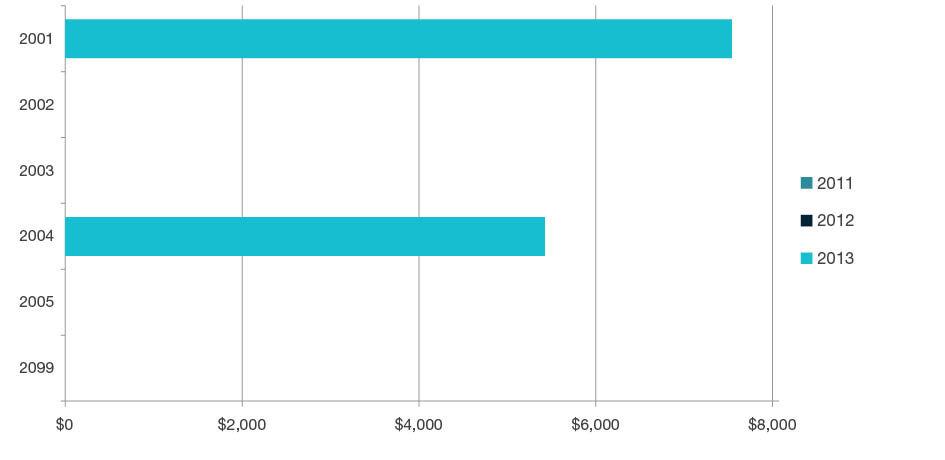
Research commercialisation income by year ($)
| FoR code |
2011 ($) |
2012 ($) |
2013 ($) |
Total ($) |
|---|---|---|---|---|
2001 Communication and Media Studies |
0 |
0 |
7,539 |
7,539 |
2002 Cultural Studies |
0 |
0 |
0 |
0 |
2003 Language Studies |
0 |
0 |
0 |
0 |
2004 Linguistics |
0 |
0 |
5,424 |
5,424 |
2005 Literary Studies |
0 |
0 |
0 |
0 |
2099 Other Language, Communication and Culture |
0 |
0 |
0 |
0 |
Total |
0 |
0 |
12,963 |
12,963 |