Section 3: Results by Fields of Research Code
14 Economics
Economics is comprised of the following four-digit codes:
- 1401 Economic Theory
- 1402 Applied Economics
- 1403 Econometrics
- 1499 Other Economics
7 out of 34 two-digit UoEs and 18 out of 46 four-digit UoEs assessed were rated above world standard
FoR Overview
Economics (14) accounted for approximately two per cent of the research outputs submitted to ERA 2015. Journal articles were the primary research output type (76 per cent). Applied Economics (1402) was the largest Economics sub-discipline, in terms of research outputs, research income, staffing levels and research commercialisation income.
| Indicator |
No. |
|---|---|
Research outputs |
7,386.5 |
Research income |
$151,172,292 |
FTEs |
947.3 |
Esteem count |
91.9 |
Patents |
- |
Research commercialisation income |
$12,843 |
| Rating |
Distribution |
|
|---|---|---|
| Two-digit |
Four-digit |
|
5 |
3 |
10 |
4 |
4 |
8 |
3 |
10 |
14 |
2 |
16 |
13 |
1 |
1 |
1 |
Total |
34 |
46 |
Number of UoEs per rating scale score
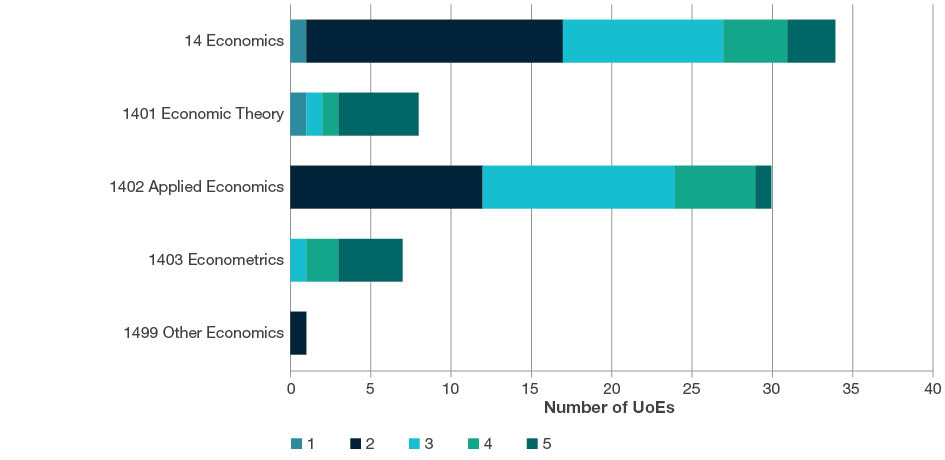
Note: 14 Economics shows assessed two-digit UoEs only.
Research outputs submitted by type

| FoR code |
Book |
Book Chapter |
Journal Article |
Conference Paper |
NTRO |
Total |
|---|---|---|---|---|---|---|
1401 Economic Theory |
15.0 |
77.3 |
576.7 |
82.6 |
1.0 |
752.5 |
1402 Applied Economics |
85.6 |
726.0 |
4,120.9 |
315.8 |
64.5 |
5,312.8 |
1403 Econometrics |
7.9 |
62.2 |
542.7 |
69.2 |
1.0 |
683.0 |
1499 Other Economics |
12.4 |
106.7 |
365.9 |
148.2 |
4.9 |
638.2 |
Total |
120.9 |
972.2 |
5,606.2 |
615.8 |
71.4 |
7,386.5 |
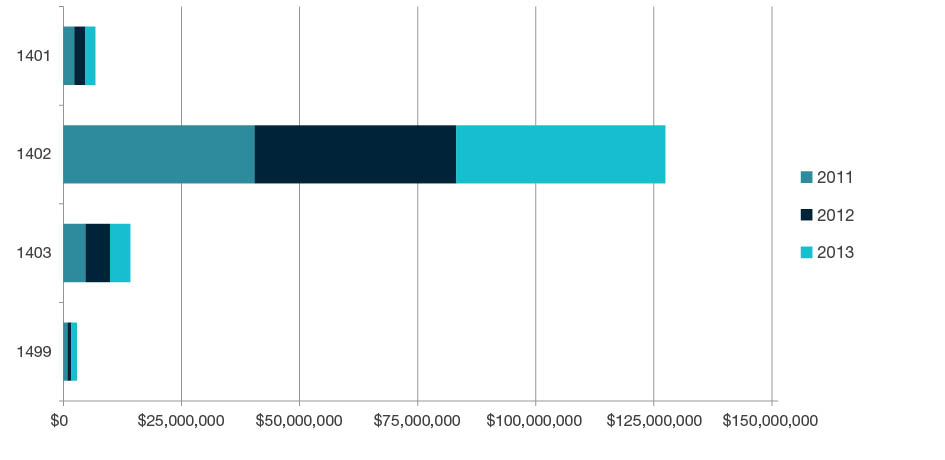
Research income by year-all categories ($)
| FoR code |
2011 ($) |
2012 ($) |
2013 ($) |
Total ($) |
|---|---|---|---|---|
1401 Economic Theory |
2,283,601 |
2,293,477 |
2,161,014 |
6,738,091 |
1402 Applied Economics |
40,502,304 |
42,664,126 |
44,260,373 |
127,426,803 |
1403 Econometrics |
4,700,113 |
5,175,075 |
4,323,065 |
14,198,254 |
1499 Other Economics |
859,913 |
830,124 |
1,119,107 |
2,809,144 |
Total |
48,345,931 |
50,962,802 |
51,863,559 |
151,172,292 |
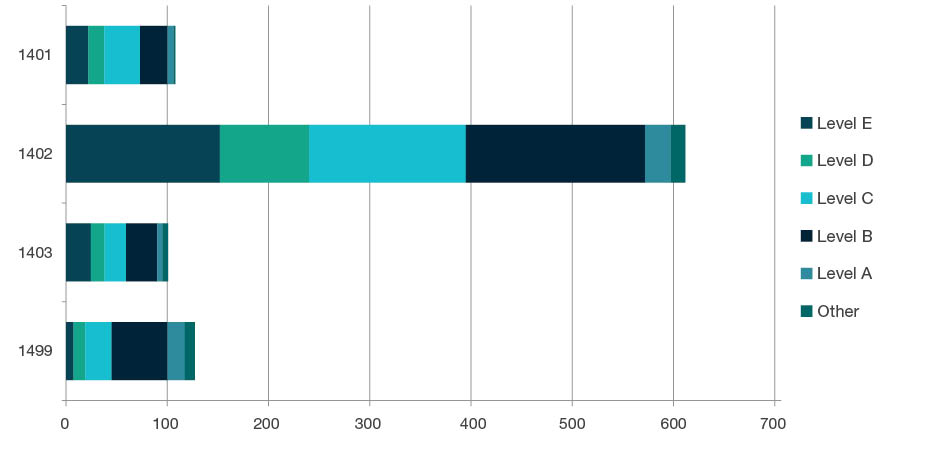
Staffing profile by academic level
| FoR code |
Level E |
Level D |
Level C |
Level B |
Level A |
Other FTE |
Total |
|---|---|---|---|---|---|---|---|
1401 Economic Theory |
21.9 |
15.7 |
35.5 |
26.9 |
6.0 |
1.8 |
107.8 |
1402 Applied Economics |
151.8 |
88.3 |
154.6 |
177.2 |
25.1 |
14.5 |
611.5 |
1403 Econometrics |
24.3 |
13.8 |
21.1 |
30.9 |
5.0 |
5.6 |
100.7 |
1499 Other Economics |
7.3 |
11.6 |
26.1 |
55.1 |
17.0 |
10.2 |
127.3 |
Total |
205.2 |
129.4 |
237.3 |
290.1 |
53.1 |
32.1 |
947.3 |
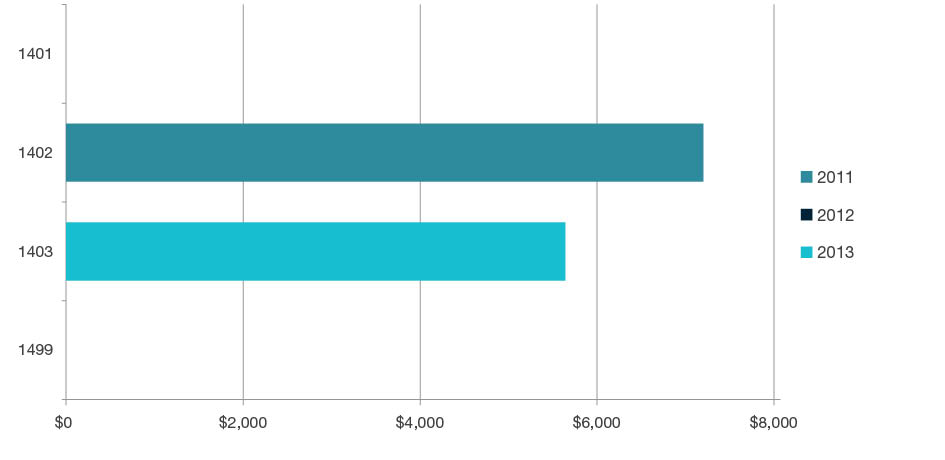
Research commercialisation income by year ($)
| FoR code |
2011 ($) |
2012 ($) |
2013 ($) |
Total ($) |
|---|---|---|---|---|
1401 Economic Theory |
0 |
0 |
0 |
0 |
1402 Applied Economics |
7,201 |
0 |
0 |
7,201 |
1403 Econometrics |
0 |
0 |
5,642 |
5,642 |
1499 Other Economics |
0 |
0 |
0 |
0 |
Total |
7,201 |
0 |
5,642 |
12,843 |