Search
 

Section 1

Percentage Contribution to the National Landscape

The following charts show the research activity attributed to two-digit FoRs as a proportion of total research activity submitted to all FoR codes in ERA 2015 for research outputs, research income, staff (FTE), esteem, patents granted and research commercialisation income.

Each chart shows how much of the total national share is contributed by the two-digit codes to each of the indicators that form part of the ERA 2015 evaluation. For example, 06 Biological Sciences account for a seven per cent share of the national total of research outputs, a 10 per cent share of the national total of research income, an eight per cent share of the national total of staff (FTE), an 11 per cent share of national total of esteem measures, a 13 per cent share of the national total of patents granted and a three per cent share of the national total of research commercialisation income.

Research outputs
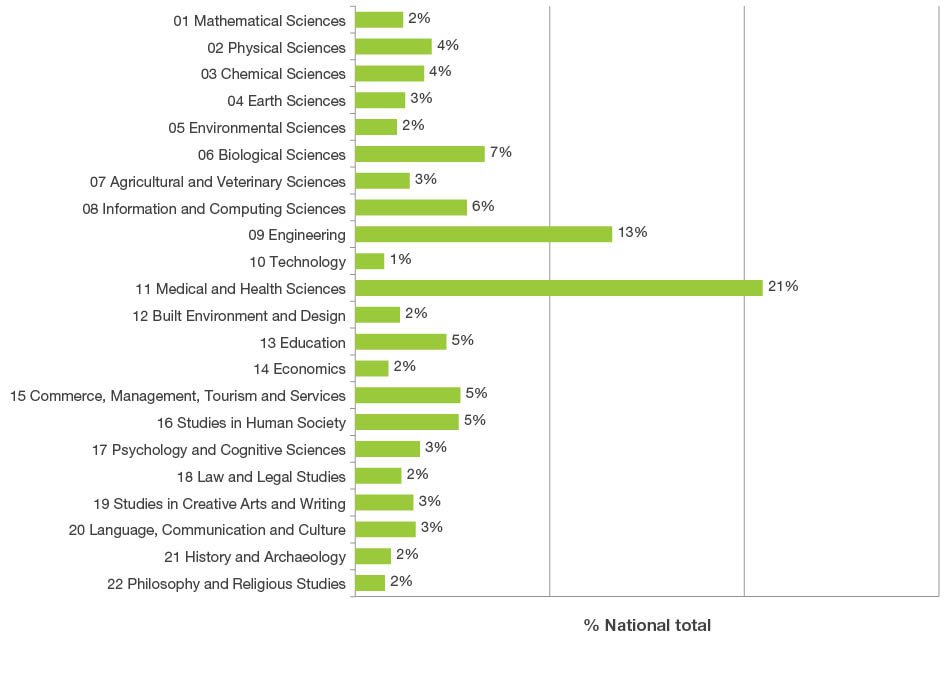
Bar graph displaying the national share of research outputs across two-digit Fields of Research codes. The top three Fields of Research codes are 11 Medical and Health Sciences 21 per cent, 09 Engineering 13 per cent and 06 Biological Sciences seven per cent. The lowest percentage share of research outputs was 10 Technology at one percent.

Research income

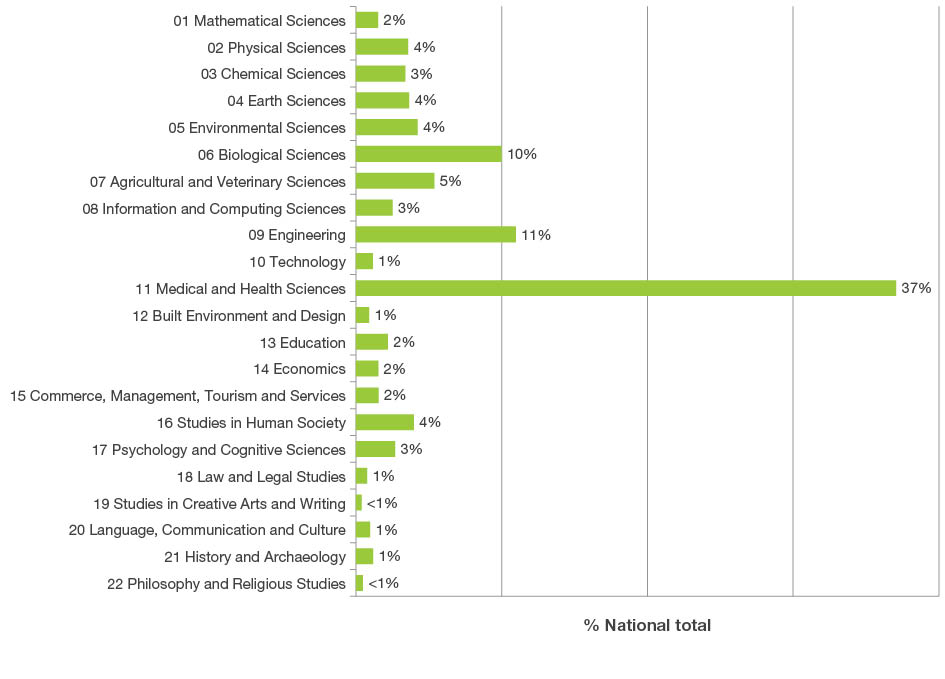
Bar graph displaying the national share of research income across two-digit Fields of Research codes. The top three Fields of Research codes are 11 Medical and Health Sciences 37 per cent, 09 Engineering 11 per cent and 06 Biological Sciences 10 per cent. The codes with the lowest percentage share were 19 Studies in Creative Arts and Writing and 22 Philosophy and Religious Studies with less than one per cent each.

Staff (FTE)

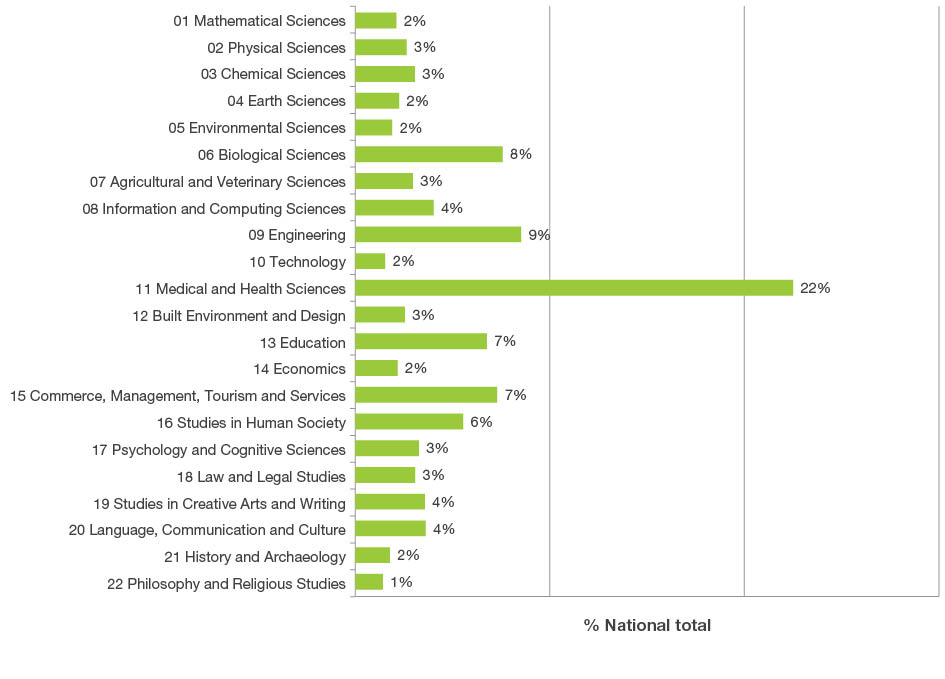
Bar graph displaying the national share of <abbr>FTE</abbr> staff across two-digit Fields of Research codes. The top three Fields of Research codes are 11 Medical and Health Sciences 22 per cent, 09 Engineering nine per cent and 06 Biological Sciences eight per cent. The lowest percentage share was 22 Philosophy and Religious Studies with one per cent.

Esteem

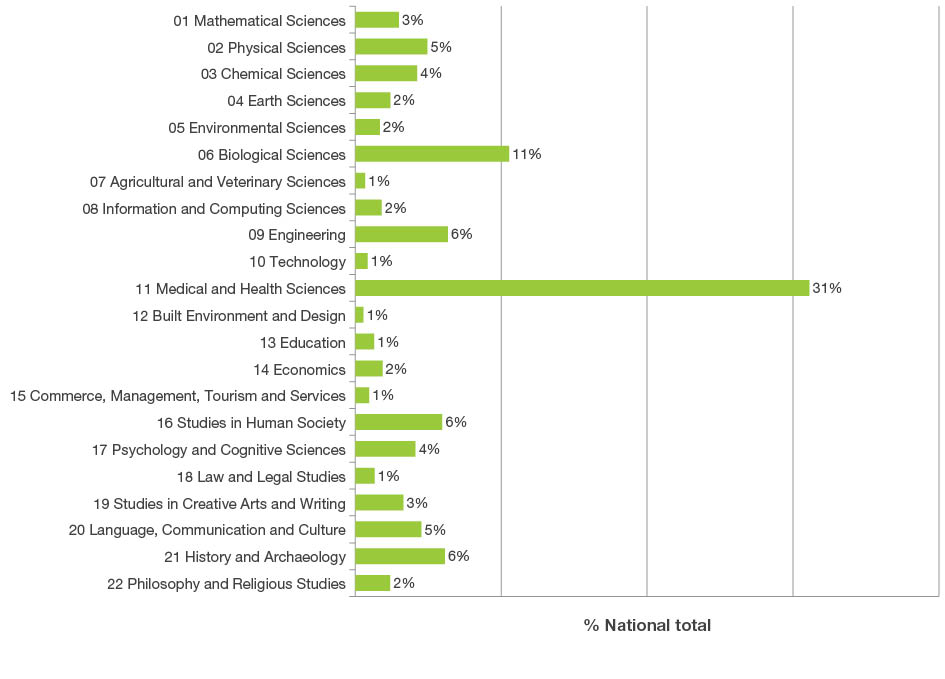
Bar graph displaying the national share of Esteem measures across two-digit Fields of Research codes. The top three Fields of Research codes are 11 Medical and Health Sciences 31 per cent, 06 Biological Sciences 11 per cent, and 09 Engineering six per cent. The lowest percentage share was 12 Built Environment and Design one per cent.

Patents granted

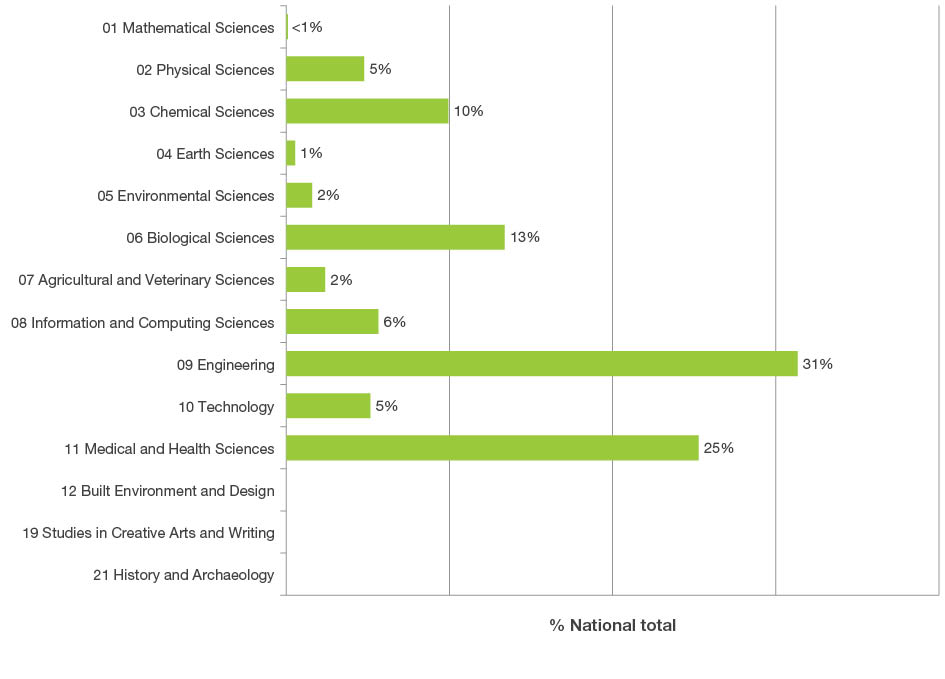
Bar graph displaying the national share of patents granted across two-digit Fields of Research codes. The top three Fields of Research codes are 09 Engineering 31 per cent, 11 Medical and Health Sciences 25 per cent and 06 Biological Sciences 13 per cent. Three codes did not submit any patents granted, these were 12 Built Environment and Design, 19 Studies in Creative Arts and Writing and 21 History and Archaeology.

Note: The FoRs that do not use patents as an Applied Measure do not appear in the table.

Research commercialisation income
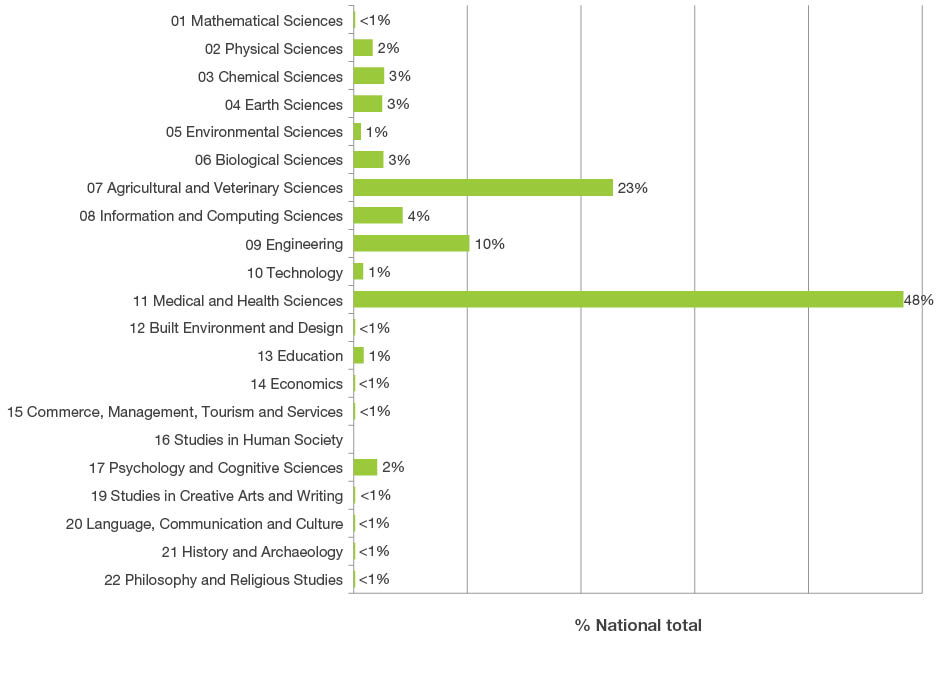
Bar graph displaying the national share of Research Commercialisation Income across two-digit Fields of Research codes. The top three Fields of Research codes are 11 Medical and Health Sciences 48 per cent, 07 Agricultural and Veterinary Sciences 23 per cent and 09 Engineering 10 per cent. 16 Studies in Human Society did not report any Research Commercialisation Income.

Note: Two- and four-digit FoR codes for Law and Legal Studies (18) do not use research commercialisation income as an applied measure nor do some underlying four-digit codes in Medical and Health Sciences (11).