Section 3: Results by Fields of Research Code
09 Engineering
Engineering is comprised of the following four-digit codes:
- 0901 Aerospace Engineering
- 0902 Automotive Engineering
- 0903 Biomedical Engineering
- 0904 Chemical Engineering
- 0905 Civil Engineering
- 0906 Electrical and Electronic Engineering
- 0907 Environmental Engineering
- 0908 Food Sciences
- 0909 Geomatic Engineering
- 0910 Manufacturing Engineering
- 0911 Maritime Engineering
- 0912 Materials Engineering
- 0913 Mechanical Engineering
- 0914 Resources Engineering and Extractive Metallurgy
- 0915 Interdisciplinary Engineering
- 0999 Other Engineering
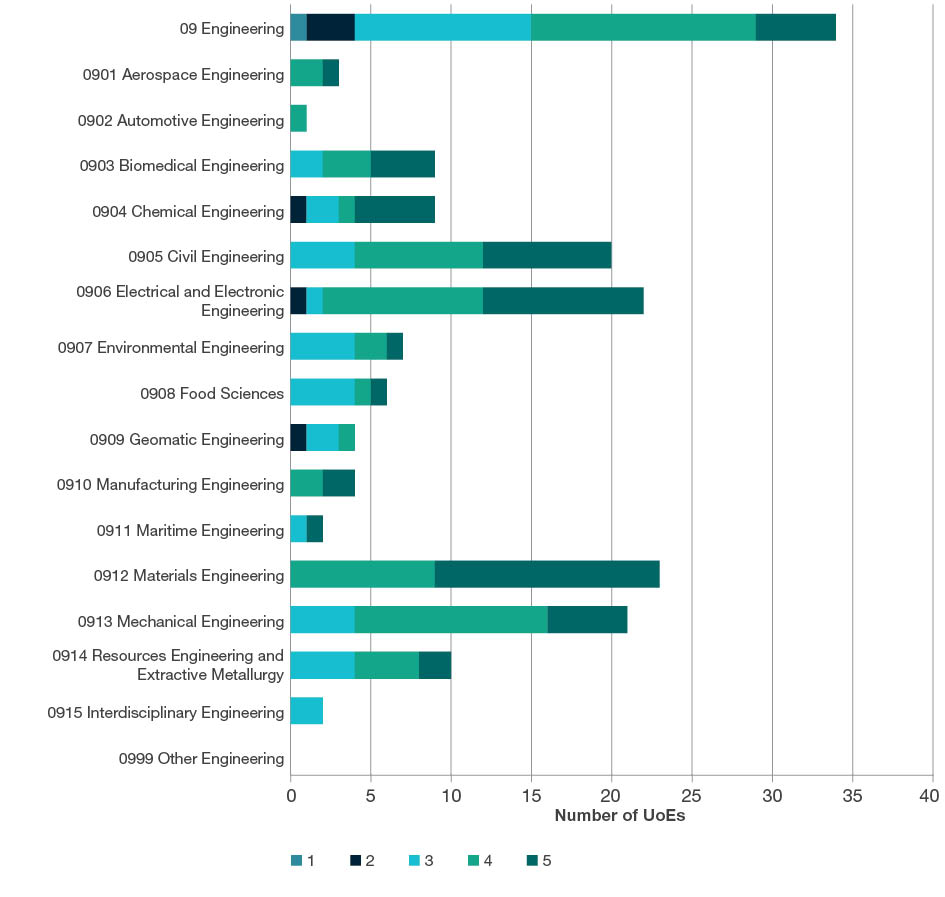
19 out of 34 two-digit UoEs and 110 out of 143 four-digit UoEs assessed were rated above world standard
FoR Overview
Engineering (09) accounted for approximately 13 per cent of the research outputs submitted to ERA 2015. Approximately 31 per cent of the patents submitted to ERA 2015 were in Engineering. While journal articles were the predominant research output type (57 per cent), a large proportion of conference publications were also submitted to Engineering codes (39 per cent). Electrical and Electronic Engineering (0906) was the largest sub-discipline in terms of research outputs, staffing, research income, patents and research commercialisation income.
| Indicator |
No. |
|---|---|
Research outputs |
57,124.6 |
Research income |
$1,085,215,725 |
FTEs |
3,711.3 |
Esteem count |
312.9 |
Patents |
293.3 |
Research commercialisation income |
$15,873,506 |
| Rating |
Distribution |
|
|---|---|---|
| Two-digit |
Four-digit |
|
5 |
5 |
54 |
4 |
14 |
56 |
3 |
11 |
30 |
2 |
3 |
3 |
1 |
1 |
0 |
Total |
34 |
143 |
Number of UoEs per rating scale score

Note: 09 Engineering shows assessed two-digit UoEs only.
Research outputs submitted by type

| FoR code |
Book |
Book Chapter |
Journal Article |
Conference Paper |
NTRO |
Total |
|---|---|---|---|---|---|---|
0901 Aerospace Engineering |
2.7 |
34.0 |
572.3 |
456.3 |
1.0 |
1,066.1 |
0902 Automotive Engineering |
0.0 |
12.4 |
329.9 |
310.4 |
2.4 |
655.1 |
0903 Biomedical Engineering |
4.3 |
98.3 |
1,718.8 |
884.6 |
1.0 |
2,707.1 |
0904 Chemical Engineering |
8.0 |
166.6 |
4,365.2 |
1,083.8 |
4.0 |
5,627.6 |
0905 Civil Engineering |
42.6 |
242.5 |
4,711.5 |
4,353.2 |
14.1 |
9,363.9 |
0906 Electrical and Electronic Engineering |
35.6 |
286.6 |
4,680.6 |
7,474.5 |
3.7 |
12,481.1 |
0907 Environmental Engineering |
4.1 |
81.0 |
1,171.0 |
597.8 |
9.9 |
1,863.8 |
0908 Food Sciences |
2.3 |
55.1 |
1,044.8 |
67.3 |
3.2 |
1,172.6 |
0909 Geomatic Engineering |
5.0 |
132.7 |
687.5 |
627.0 |
2.0 |
1,454.2 |
0910 Manufacturing Engineering |
0.2 |
33.8 |
900.2 |
380.5 |
1.0 |
1,315.8 |
0911 Maritime Engineering |
2.3 |
7.8 |
385.7 |
366.5 |
0.0 |
762.3 |
0912 Materials Engineering |
19.6 |
185.8 |
5,839.2 |
1,043.1 |
0.0 |
7,087.7 |
0913 Mechanical Engineering |
20.4 |
209.8 |
3,258.9 |
2,262.9 |
0.9 |
5,752.9 |
0914 Resources Engineering and Extractive Metallurgy |
6.6 |
44.4 |
1,528.3 |
953.0 |
12.1 |
2,544.4 |
0915 Interdisciplinary Engineering |
4.3 |
56.0 |
807.6 |
637.3 |
1.0 |
1,506.3 |
0999 Other Engineering |
5.3 |
29.5 |
804.4 |
917.7 |
6.8 |
1,763.8 |
Total |
163.3 |
1,676.3 |
32,805.8 |
22,416.1 |
63.1 |
57,124.6 |
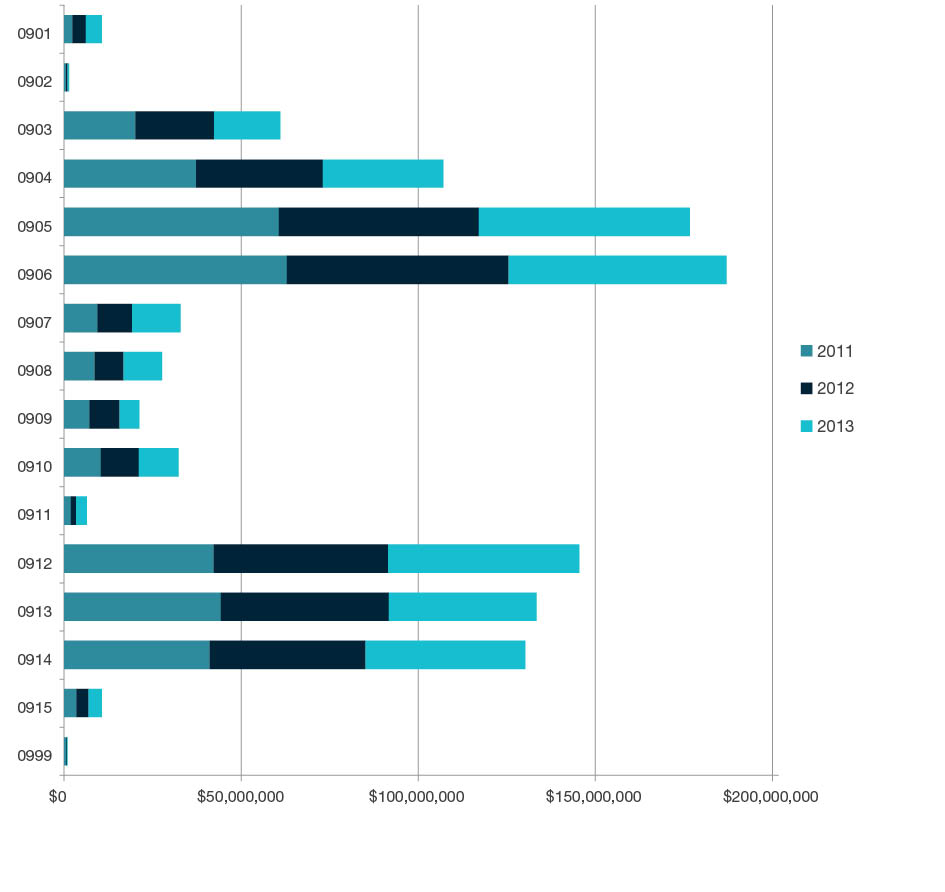
Research income by year-all categories ($)

| FoR code |
2011 ($) |
2012 ($) |
2013 ($) |
Total ($) |
|---|---|---|---|---|
0901 Aerospace Engineering |
2,328,930 |
3,821,844 |
4,513,345 |
10,664,120 |
0902 Automotive Engineering |
568,523 |
431,492 |
374,871 |
1,374,886 |
0903 Biomedical Engineering |
20,076,910 |
22,292,552 |
18,700,219 |
61,069,681 |
0904 Chemical Engineering |
37,301,339 |
35,778,555 |
34,041,774 |
107,121,668 |
0905 Civil Engineering |
60,630,245 |
56,432,844 |
59,621,407 |
176,684,496 |
0906 Electrical and Electronic Engineering |
62,901,376 |
62,622,191 |
61,529,828 |
187,053,396 |
0907 Environmental Engineering |
9,395,395 |
9,798,147 |
13,673,771 |
32,867,313 |
0908 Food Sciences |
8,597,072 |
8,194,459 |
10,907,320 |
27,698,851 |
0909 Geomatic Engineering |
7,161,295 |
8,502,892 |
5,549,118 |
21,213,305 |
0910 Manufacturing Engineering |
10,369,106 |
10,744,396 |
11,210,556 |
32,324,058 |
0911 Maritime Engineering |
1,934,589 |
1,434,795 |
3,013,620 |
6,383,005 |
0912 Materials Engineering |
42,229,967 |
49,237,995 |
53,992,121 |
145,460,084 |
0913 Mechanical Engineering |
44,290,556 |
47,411,916 |
41,704,440 |
133,406,912 |
0914 Resources Engineering and Extractive Metallurgy |
41,042,708 |
44,063,125 |
45,103,929 |
130,209,762 |
0915 Interdisciplinary Engineering |
3,473,593 |
3,427,627 |
3,779,701 |
10,680,921 |
0999 Other Engineering |
585,661 |
198,608 |
218,999 |
1,003,268 |
Total |
352,887,265 |
364,393,440 |
367,935,020 |
1,085,215,725 |
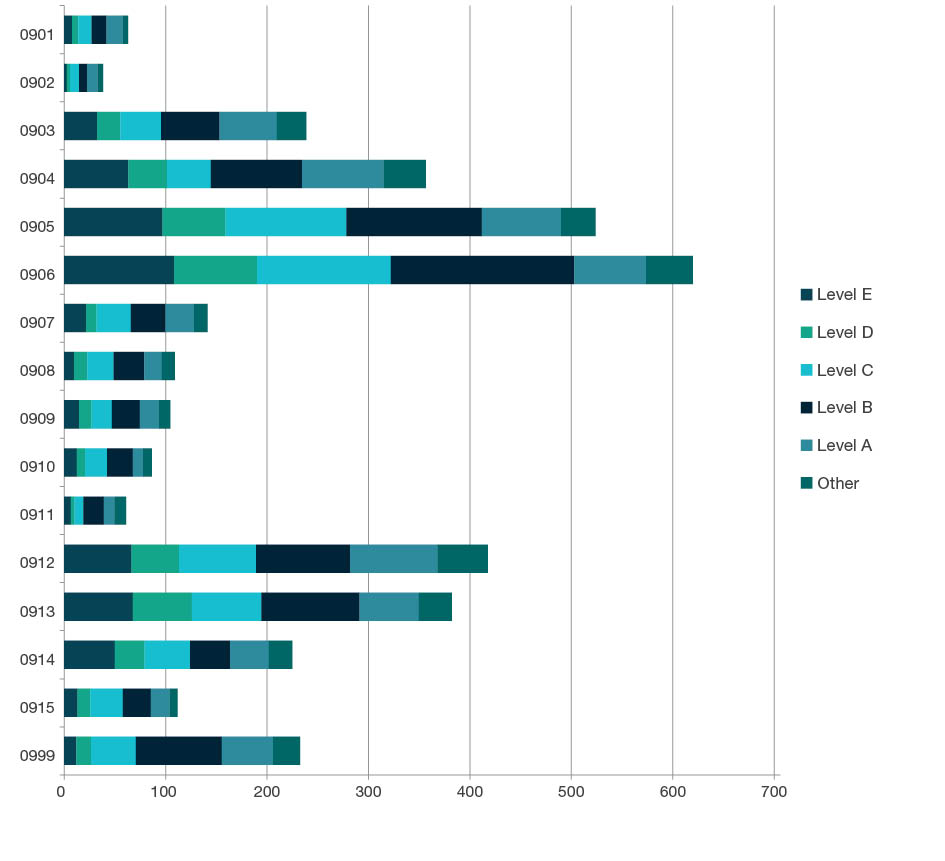
Staffing profile by academic level

| FoR code |
Level E |
Level D |
Level C |
Level B |
Level A |
Other FTE |
Total |
|---|---|---|---|---|---|---|---|
0901 Aerospace Engineering |
7.7 |
6.1 |
13.1 |
14.8 |
15.8 |
5.3 |
62.9 |
0902 Automotive Engineering |
2.6 |
3.3 |
9.0 |
7.8 |
10.2 |
5.6 |
38.3 |
0903 Biomedical Engineering |
32.5 |
22.9 |
40.0 |
57.7 |
56.4 |
29.2 |
238.7 |
0904 Chemical Engineering |
63.2 |
38.2 |
43.0 |
90.0 |
80.4 |
41.7 |
356.6 |
0905 Civil Engineering |
96.9 |
62.0 |
119.3 |
133.5 |
78.1 |
34.1 |
523.9 |
0906 Electrical and Electronic Engineering |
108.4 |
81.6 |
132.1 |
181.0 |
70.6 |
46.2 |
619.8 |
0907 Environmental Engineering |
21.4 |
10.7 |
33.7 |
34.2 |
28.0 |
13.4 |
141.2 |
0908 Food Sciences |
9.6 |
13.0 |
26.1 |
30.2 |
17.2 |
12.9 |
109.0 |
0909 Geomatic Engineering |
14.6 |
12.4 |
20.0 |
27.6 |
18.9 |
11.1 |
104.6 |
0910 Manufacturing Engineering |
12.2 |
8.3 |
21.6 |
25.4 |
10.3 |
8.7 |
86.5 |
0911 Maritime Engineering |
6.5 |
3.6 |
8.7 |
20.1 |
10.4 |
11.8 |
61.1 |
0912 Materials Engineering |
66.3 |
46.9 |
75.8 |
92.8 |
86.1 |
49.8 |
417.7 |
0913 Mechanical Engineering |
67.5 |
58.2 |
68.5 |
97.2 |
58.2 |
32.4 |
382.0 |
0914 Resources Engineering and Extractive Metallurgy |
49.9 |
29.3 |
45.0 |
39.3 |
38.2 |
23.1 |
224.8 |
0915 Interdisciplinary Engineering |
13.2 |
12.6 |
32.1 |
27.4 |
18.5 |
8.0 |
111.8 |
0999 Other Engineering |
11.8 |
14.6 |
44.1 |
84.9 |
50.5 |
26.5 |
232.4 |
Total |
584.2 |
423.6 |
732.1 |
963.8 |
647.7 |
359.9 |
3,711.3 |
Patent profile
| FoR code |
Australia |
USA |
Europe |
Japan |
Other International |
Triadic |
Total |
|---|---|---|---|---|---|---|---|
0901 Aerospace Engineering |
0.0 |
0.0 |
0.0 |
0.0 |
0.0 |
0.0 |
0.0 |
0902 Automotive Engineering |
0.0 |
0.0 |
0.0 |
0.0 |
0.0 |
0.0 |
0.0 |
0903 Biomedical Engineering |
5.9 |
9.4 |
3.5 |
3.3 |
5.9 |
0.0 |
28.0 |
0904 Chemical Engineering |
11.9 |
10.1 |
5.8 |
6.0 |
25.6 |
0.0 |
59.4 |
0905 Civil Engineering |
2.2 |
2.2 |
0.2 |
1.0 |
6.0 |
0.0 |
11.6 |
0906 Electrical and Electronic Engineering |
6.5 |
32.6 |
6.7 |
1.5 |
30.3 |
0.0 |
77.7 |
0907 Environmental Engineering |
2.0 |
1.0 |
0.0 |
0.0 |
0.4 |
0.0 |
3.4 |
0908 Food Sciences |
0.0 |
1.0 |
0.0 |
0.0 |
1.0 |
0.0 |
2.0 |
0909 Geomatic Engineering |
0.0 |
0.0 |
0.0 |
0.0 |
0.0 |
0.0 |
0.0 |
0910 Manufacturing Engineering |
0.0 |
0.0 |
0.0 |
0.0 |
0.0 |
0.0 |
0.0 |
0911 Maritime Engineering |
0.0 |
0.0 |
0.0 |
0.0 |
0.0 |
0.0 |
0.0 |
0912 Materials Engineering |
4.8 |
10.2 |
7.8 |
6.5 |
18.9 |
0.0 |
48.3 |
0913 Mechanical Engineering |
9.0 |
2.5 |
1.0 |
0.0 |
6.5 |
0.0 |
19.0 |
0914 Resources Engineering and Extractive Metallurgy |
8.0 |
9.0 |
1.0 |
1.0 |
24.0 |
0.0 |
43.0 |
0915 Interdisciplinary Engineering |
1.0 |
0.0 |
0.0 |
0.0 |
0.0 |
0.0 |
1.0 |
0999 Other Engineering |
0.0 |
0.0 |
0.0 |
0.0 |
0.0 |
0.0 |
0.0 |
Total |
51.3 |
78.1 |
26.1 |
19.3 |
118.5 |
0 |
293.3 |
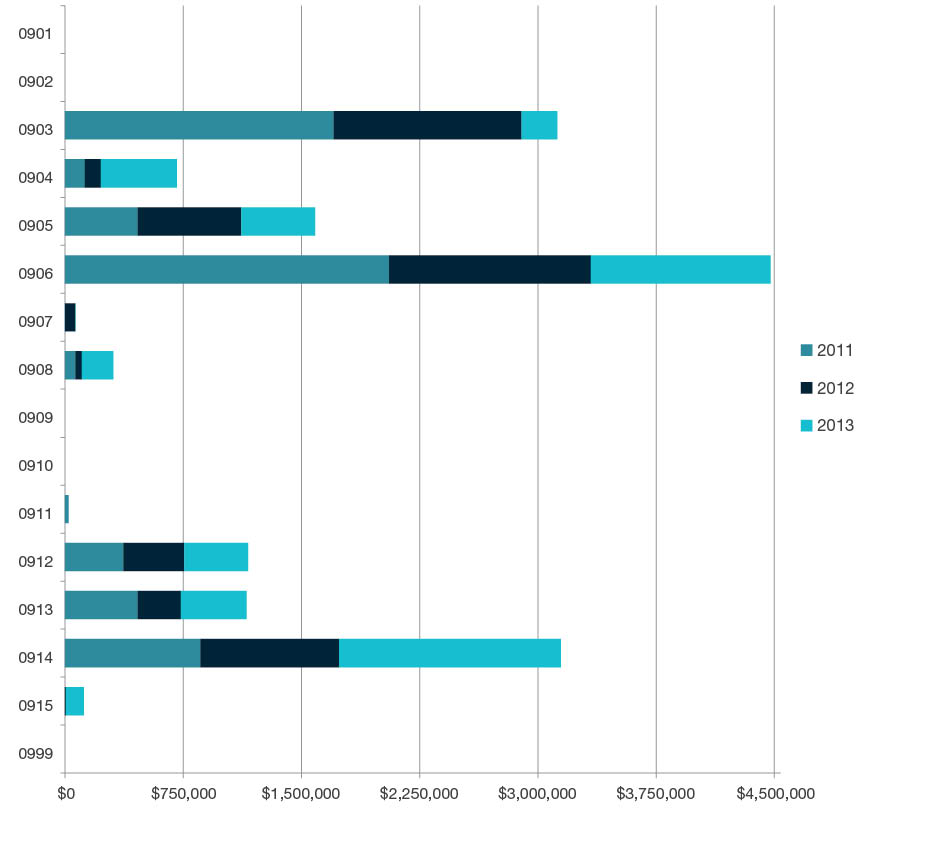
Research commercialisation income by year ($)

| FoR code |
2011 ($) |
2012 ($) |
2013 ($) |
Total ($) |
|---|---|---|---|---|
0901 Aerospace Engineering |
0 |
0 |
0 |
0 |
0902 Automotive Engineering |
0 |
0 |
0 |
0 |
0903 Biomedical Engineering |
1,704,293 |
1,192,702 |
227,350 |
3,124,344 |
0904 Chemical Engineering |
125,212 |
102,122 |
482,043 |
709,376 |
0905 Civil Engineering |
460,714 |
657,506 |
468,661 |
1,586,881 |
0906 Electrical and Electronic Engineering |
2,056,501 |
1,278,749 |
1,141,659 |
4,476,909 |
0907 Environmental Engineering |
600 |
65,778 |
316 |
66,694 |
0908 Food Sciences |
65,931 |
40,759 |
199,091 |
305,781 |
0909 Geomatic Engineering |
0 |
0 |
0 |
0 |
0910 Manufacturing Engineering |
0 |
0 |
0 |
0 |
0911 Maritime Engineering |
22,730 |
0 |
0 |
22,730 |
0912 Materials Engineering |
370,815 |
387,453 |
404,132 |
1,162,400 |
0913 Mechanical Engineering |
461,024 |
274,311 |
416,880 |
1,152,215 |
0914 Resources Engineering and Extractive Metallurgy |
859,002 |
880,657 |
1,406,542 |
3,146,202 |
0915 Interdisciplinary Engineering |
0 |
4,994 |
114,980 |
119,974 |
0999 Other Engineering |
0 |
0 |
0 |
0 |
Total |
6,126,822 |
4,885,031 |
4,861,653 |
15,873,506 |
